Member-only story
How to Debug an Angular Schematic using Visual Studio Code

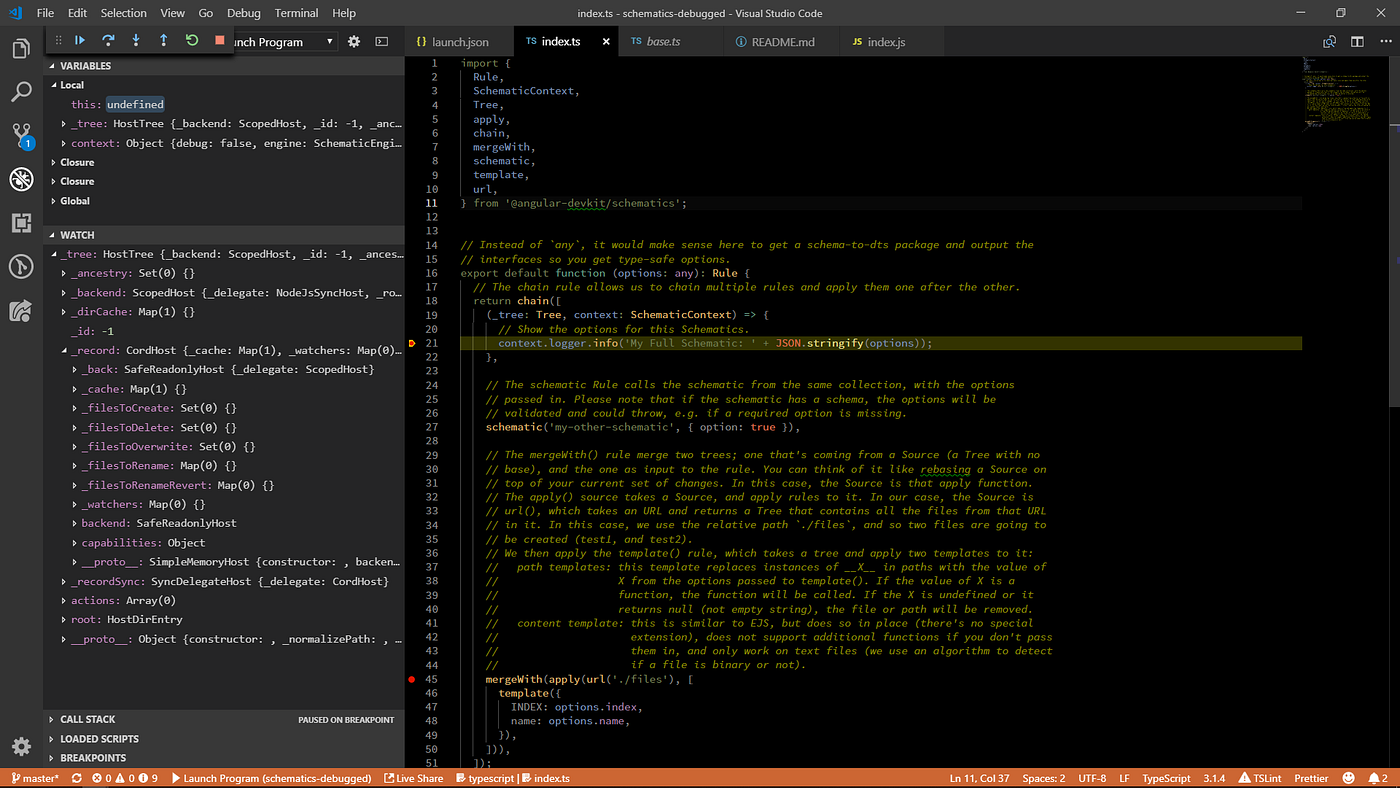
Get under the Angular Schematic hood with the VS Code Debugger.
Being able to debug and walk through code as it executes is fundamental to our development workflow. It is an essential capability that allows us to debug and determine what the code is doing. It can be part of our testing workflow — attaching a debugger and walking through tests in specific scenarios.
Debugging also provides an opportunity to learn how code (that we didn’t implement) works. This is certainly the case with schematics. As Angular developers, we have certainly used schematics on a daily basis while using the Angular CLI. We create new workspaces, projects, services, components, modules, classes and more using the CLI - and we give little thought to what is going on behind the scenes.
However, understanding how schematics work allows us to appreciate the tooling that provides us with so much functionality. But it also helps to learn how to create our own schematics. Therefore, the purpose of this post is to demonstrate:
- how to debug a schematic
- configure Visual Studio Code to debug a node program (i.e., a schematic)
- attach to a debugging process
When you run/execute a Schematic you are running a node program. The specific program we are running is schematic. So, to get started, we'll need a schematic project.
Tooling and Prerequisites
Before, we can create a schematic project using the schematic-cli, we'll need to make sure we have the following packages available to our development environment. Install the following packages using the -g to make them available globally.
npm install -g @angular-devkit/schematics
npm install -g @angular-devkit/schematics-cli
The tooling allows us to create a new schematic project using the schematics collection. Run the schematics command in a terminal.
The output is a list of options for the command.